LBD views by channel I’m not very familiar with the…
LBD views by channel
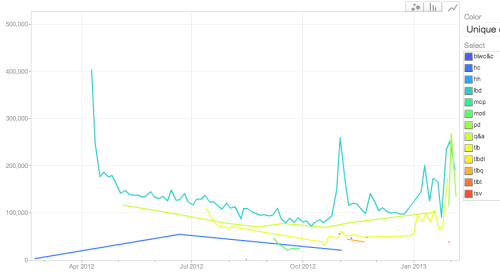
I’m not very familiar with the graphing tools in Google Docs, but with some trial and error I was able to get the above from my LBD episodes spreadsheet. If you click on the image you can get a somewhat larger one, or you can go to the spreadsheet itself and see the “Views Chart” for the interactive version, which is fun.
Every color represents a “series” in the spreadsheet, with the legend for those being:
- blwc&c – Better Living with Collins and Collins
- hc – Hank’s Channel
- hh – Lydia’s Halloween Holla Special
- lbd – The Lizzie Bennet Diaries
- mcp – Maxwell Glick’s mrcheezypop
- motl – Maria of the Lu
- pd – Pemberley Digital
- q&a – (Lizzie) Questions and Answers
- tlb – The Lydia Bennet
- tlbdl – The Lydia Bennet – Dear Lizzie
- tlbq – The Lydia Bennet Questions
- tlbt – The Lydia Bennet – Thanksgiving
- tsv – The Stylish Vids
A few things:
Some series have lots of data points (like the ‘lbd’ series for the main Lizzie Bennet Diaries videos, which is that prominent cyan line with more views than all the rest). So those are jagged squiggles. Other series just have a few data points (like the dark blue “Hank’s Channel” line at the bottom, which starts before the LBD proper and only has three videos in the spreadsheet; or the “Q&A” videos, which are the light green line that hug the bottom of the “lbd” line). So those are long, straight lines.
You could argue that this gives a misleading sense that the series with few videos look like they’re delivering more views than they actually are (especially when the videos aired at widely separated intervals). But I liked this version because I was interested in trends in per-video viewership, not relative contribution by each series to overall views. Anyway, don’t try to integrate the area under each line as a measure of overall contribution.
The steady downward trend in the ‘lbd’ series from the second episode until late September is an artifact of when I started counting views. Basically, I didn’t start keeping view statistics until September 22. So for any video with an air date prior to September 20, the view count is total views as of that date. For all videos aired after September 20, the count is views as of one week after the video aired. In other words, from October 2012 onward, the view counts are being consistently recorded. But all videos prior to that have their numbers inflated by an amount that increases the farther back in time you go (because compared to the later videos, those earlier ones had more time to accumulate views).
Even with those problems, there are some interesting things visible in the graph. The first ‘lbd’ episode (“My Name Is Lizzie Bennet”) has a huge number of views, but many of those represent one-time viewers who didn’t continue with the series (silly people). You can also see a big spike in ‘lbd’ views on November 1. That’s Darcy Day (“Are You Kidding Me?”).
There has been a big jump in view counts across all series since we’ve hit the big events of the last month, including the added publicity surrounding the 200th anniversary of P&P. Bernie Su has talked in the past about how 100,000 views was roughly the break-even point in terms of videos paying for themselves with Adsense revenue. I assume he meant all-time views, not one-week views, so for videos to be above that 100,000 line in the first week is awesome in terms of revenue. Yet all three of the main series that have aired in the past month (LBD, The Lydia Bennet, and the Pemberley Digital videos) have been consistently above that line, sometimes way above it, with some of the recent LBD and PD videos cracking 250,000 views.
That makes me happy.
Reposted from http://lies.tumblr.com/post/43050243068.
Tags: lizzie bennet diaries.
